Quick guide to Confirmatory Factor Analysis
Click on:
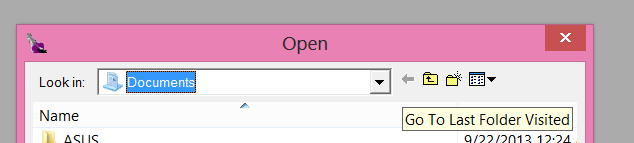
Click File > Click Open
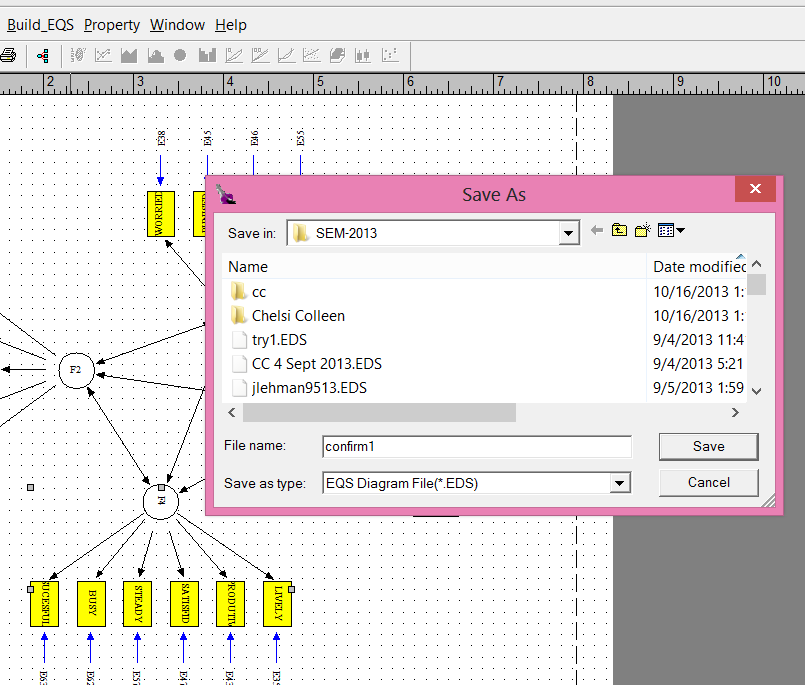
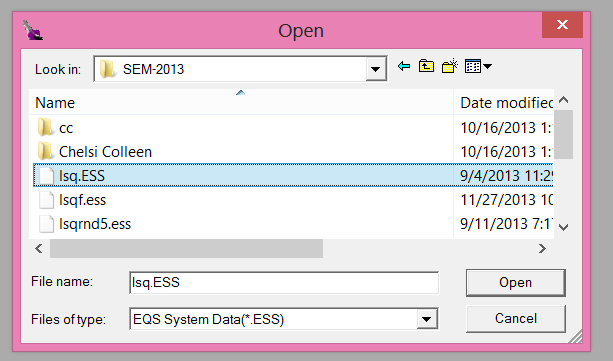
From the top box browse for the file that you can see (or have created from scratch or from existing correlations matrix [go here to see how to create a correlation matrix]). Make sure the File Type is ESS.
I have selected the lsq.ess file from the SEM-2014 folder
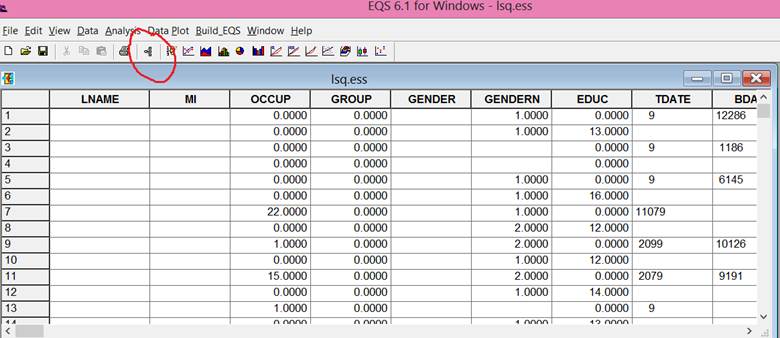
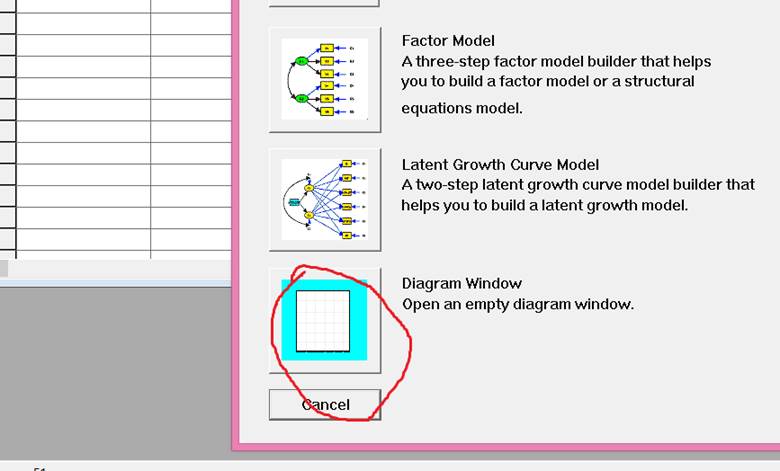
Click on red circled icon above. And then the Diagram Window below.
Then click the “factor” icon below.
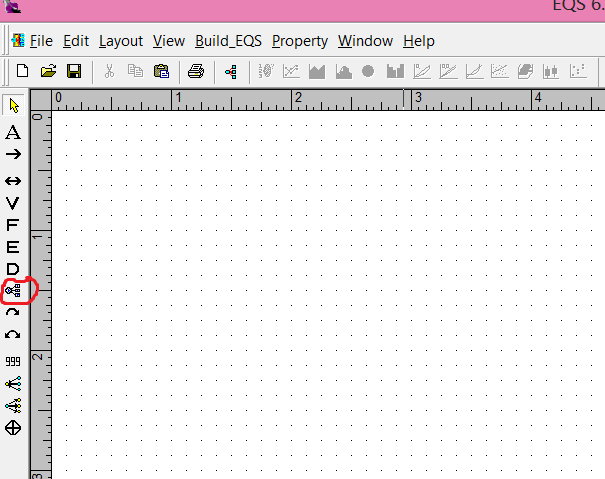
Click on red circled icon then click on dotted area and the following appears.
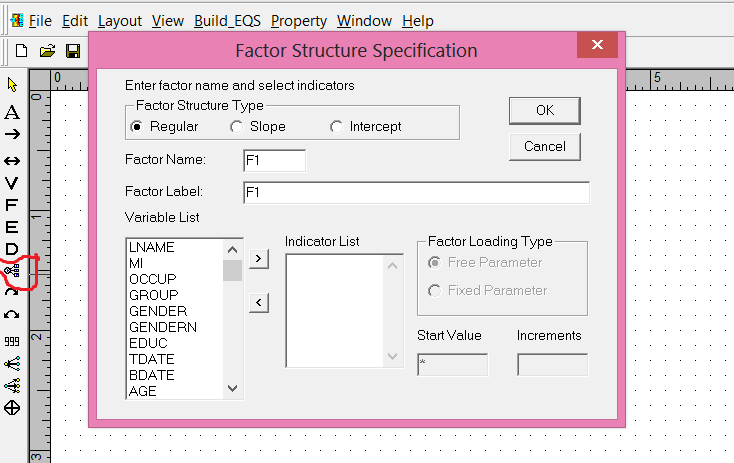
Scroll down to desired variable – see below.
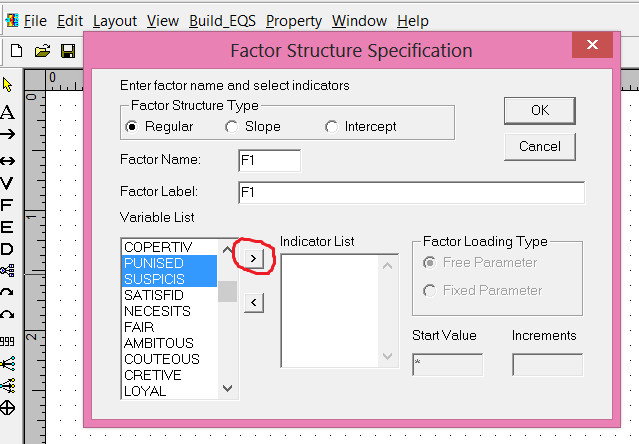
Select variables as shown then click on the “greater then”, “>” character to move the selected variables into the Indicator List (below).
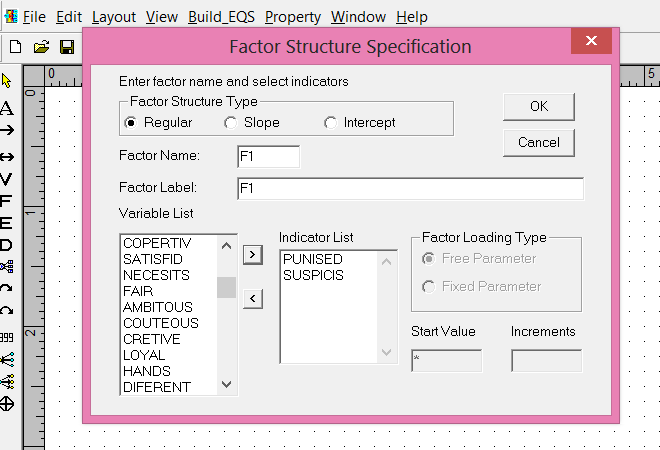
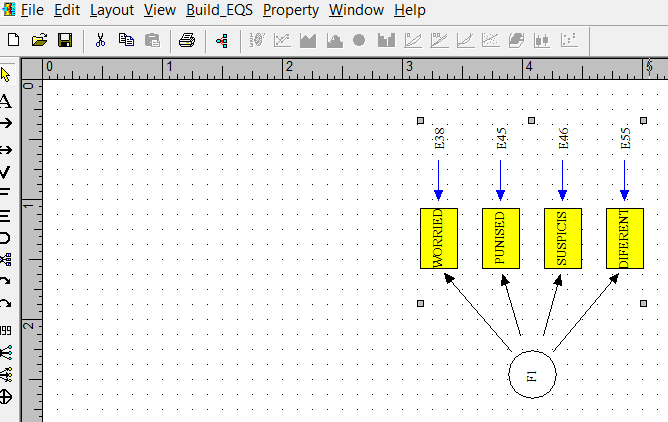
I have selected two more variables and click OK and the factor below was generated:
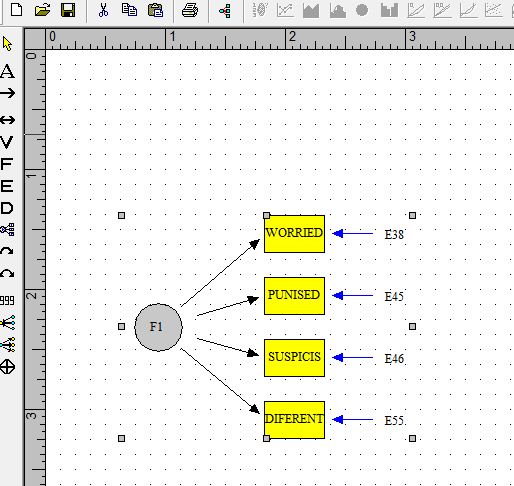
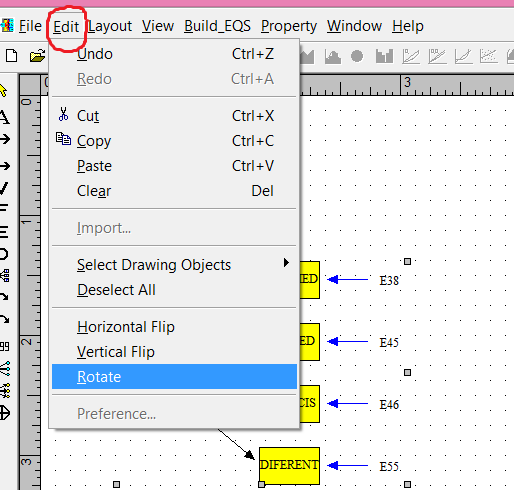
Since we are doing a confirmatory factor analysis the factors should be on the “inside” of the drawing and the measured variables (squares) around the “outside.” Consequently, we should rotate the factor and move the variables to the outside as below.
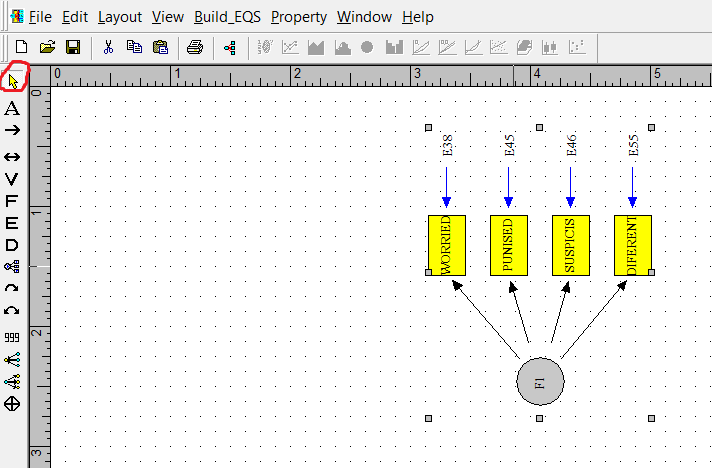
Once the factor drawing is rotated it then needs to be moved. Select the yellow arrow in the upper left hand corner (see below) then hover over the factor drawing then hold down the left mouse button and move the drawing.
For independent factors (as is the case in confirmatory factor analysis) the variance should be set to 1.0. Double click on the factor and the following window will appear.
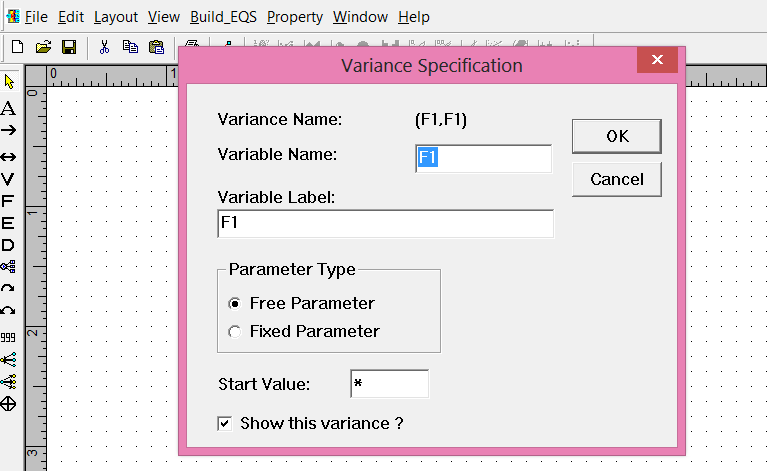
Click on Fixed Parameter and then OK and the variance will be set to 1.0, and the greyed factor changed to white (see below)
Select the remaining desired variables and factors using the above methods.
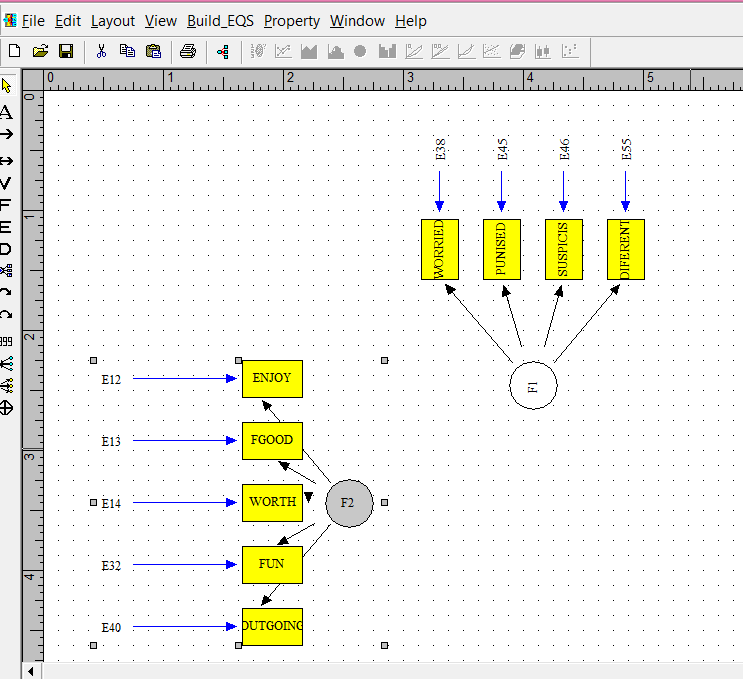
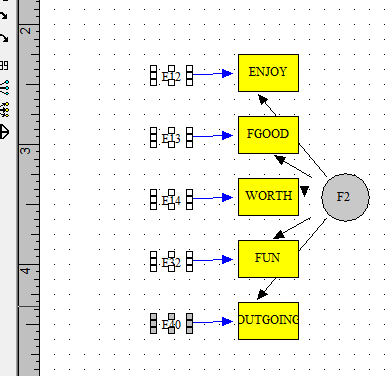
I generated F2 (factor 2) in the usual manner and then clicked on Edit and then Horizontal Flip and as can be seen there is a slight bug in the program because the parameter drawings are not quite in the proper perspective. That can be corrected in the following manner. Click on Break Group and the following appears.
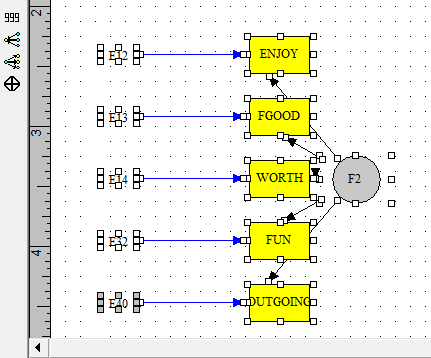
Use the yellow arrow to the Es only and then move them closer to the boxes (measured variables).
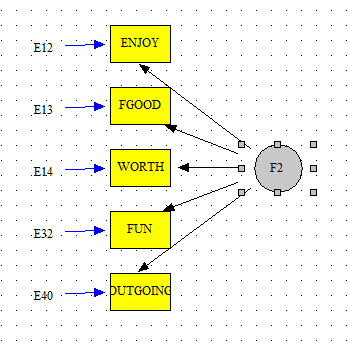
Then select the whole factor (using the yellow arrow) and move it slightly to the left.
Then using the above methods create as many factors as fits your theory.
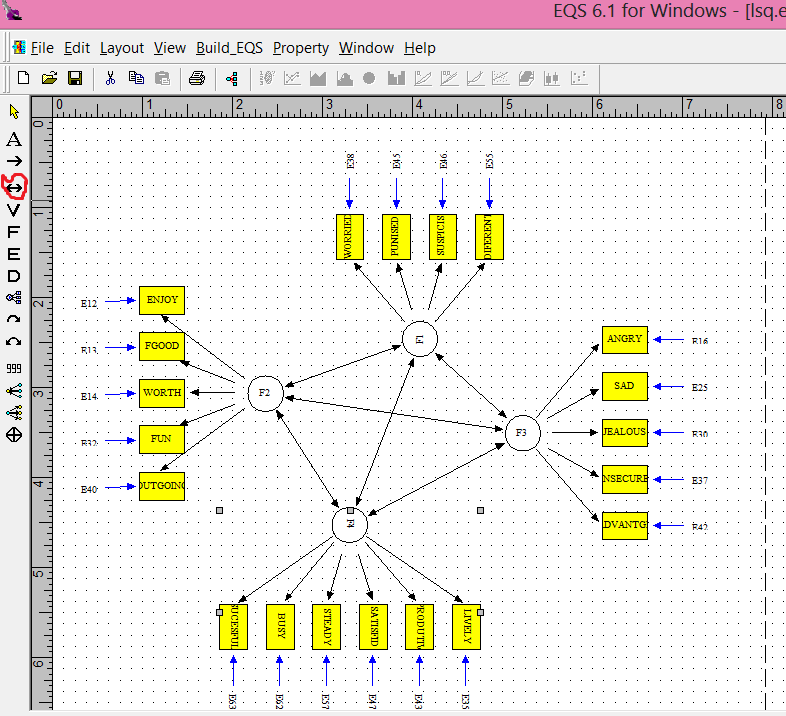
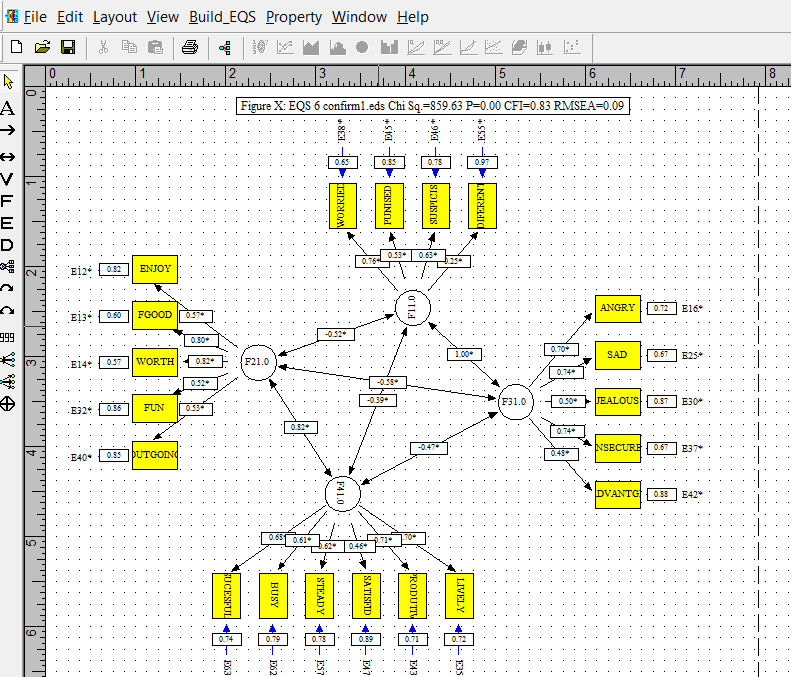
The above diagram was completed using the above methods and then using the double headed arrow (circled in red above) to generated correlations among the variables. The diagram is not ready to run.
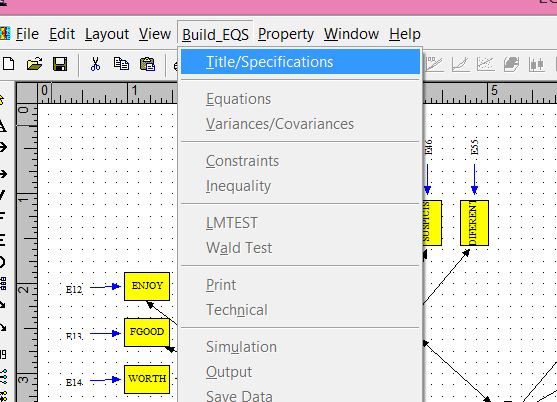
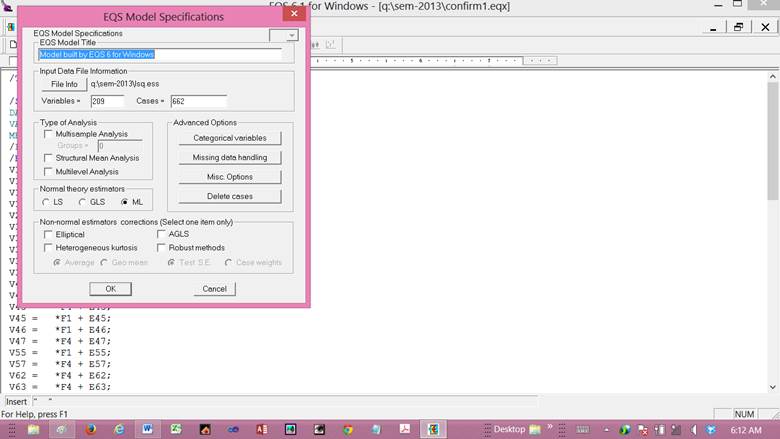
Click on Build_EQS and then click Title/Specifications.