Developing Cut Off
Scores
It is useful to be able
to use the scores from the subtests to determine whether the score would place
the respondent in a diagnostic group or not. For example, what score on the
depression subtest would place the respondent in the depression category? Such
cut scores are based on probabilities. If a person recieves a score of 6.00 on the depression subtest is that
high enough to indicate a depression diagnosis. What is the probability
that the person suffers from depression? In the sample data there are 48 cases
and 12 have the diagnosis of Anxiety. The Sanxious
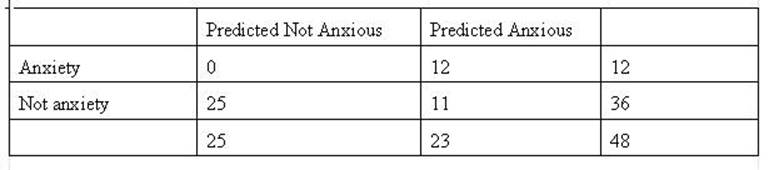
subtest score is used to indicate the probability that a respondent is has a Anxiety diagnosis. In the table
below there is not cut-off score and all respondents are predicted to be
Anxious. In actuality there are 12
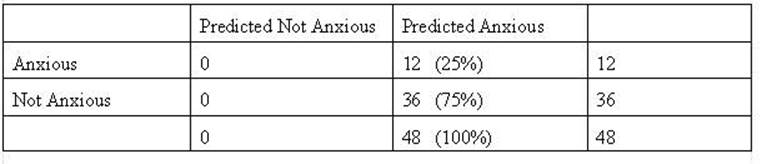
who are anxious and 36 who are not. The result is
that the prediction was 25% correct and 75% incorrect. For discussion purposes
the cells of the table are labeled as follows:
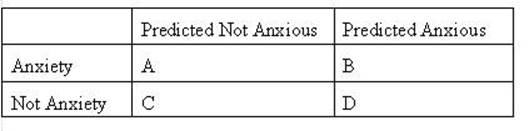
The cells B and C
indicate correct predictions or “hits” made by using the Anxiety score to
determine the diagnosis. The cells A and D indicate incorrect predictions or
“misses.
In the next example
(table below) the cut score is set to 4.5 there are no cases below that score
that have the diagnosis of Anxiety. Consequently, all of those cases are
predicted to not have anxiety. There are 25 cases with a score of 4.5 or below
and they would be placed in cell C.
The are correctly predicted because the are
predicted to be Not Anxious and the are not. In the
second table with the cut score of 4.5 (and below) there were no respondents
with the diagnosis of Anxiety. The hit rate at that level is 12 predicted to
have Anxiety and 25 to not have Anxiety (cells and B and C respectively). The
overall hit rate is 37/48 or .77 or 77%. The amount of increase from have no
information from the Anxiety is 77% - 25% or 47%. The percent of population
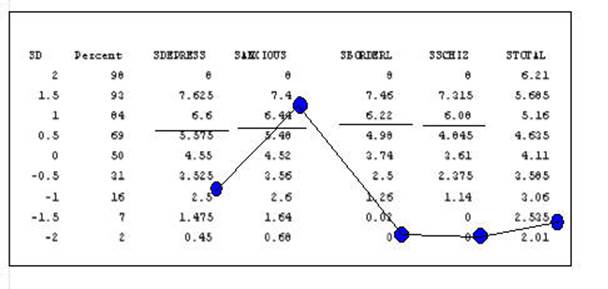
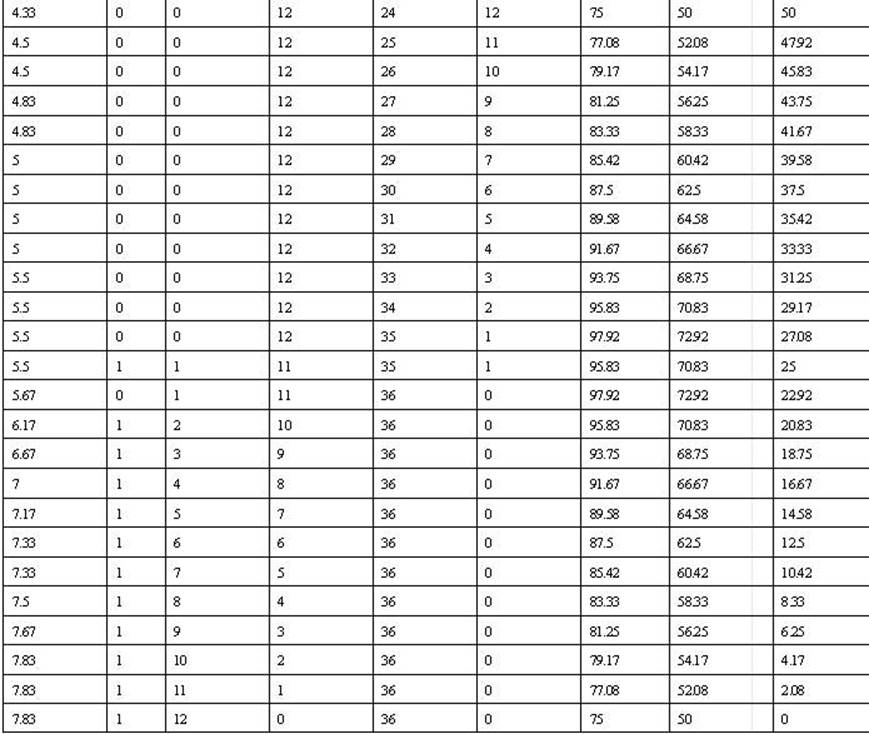
predicted to have Anxiety is (25/48)*100 or 52%. The following table computes
the cut score and responding hit rates for all possible anxiety scores of the
population.
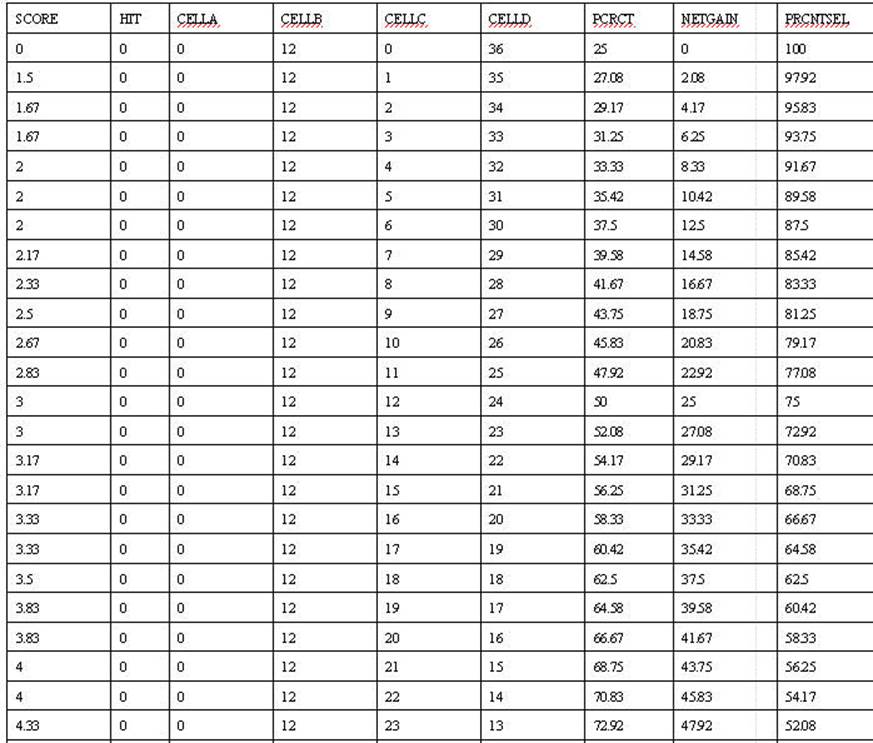
The correct prediction
at this point is 77% with an increase of 52% increase over not using the
Anxiety Scale to make the prediction. The task is to find the score that
optimizes the prediction. The score of 5.67 appears to be the appropriate cut.
Any score above 5.67 would be predicted to be in the anxiety category. At that
level the predictions would 97.92% correct with an increase of 72.92 increase
of predicting that everone has Anxiety.
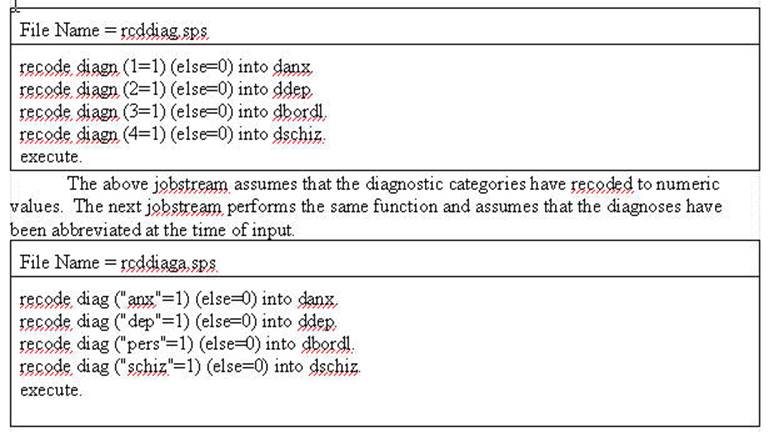
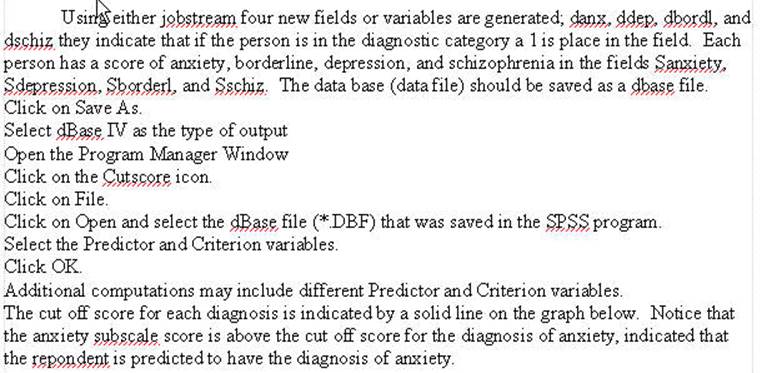
The calculation of cut
scores is obtained in the following manner. Use the following Syntax File to
generate a field for each diagnostic category (indicates a “hit” on that
diagnosis).