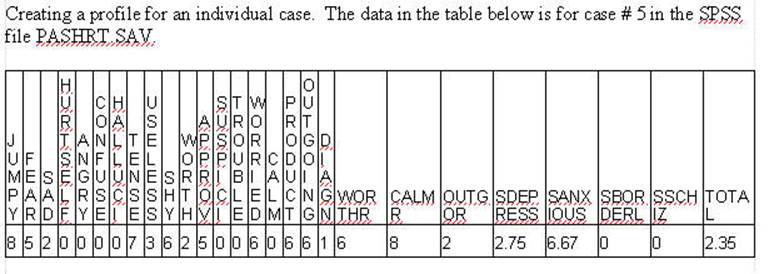
Generating Norms for a Test
The following syntax
files scores the subtests of depression (sdepress),
anxious (sanxious), hurtself
(shurdetl), and schizophrenia (sschiz).
Scoring Subtests
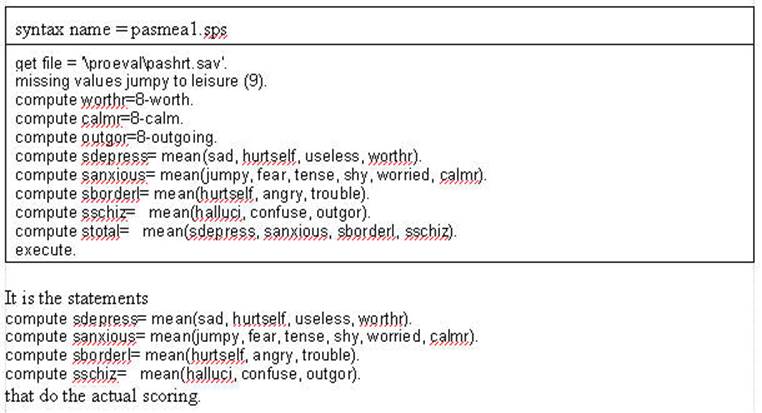
Click here
for more detailed description of scoring Likert items.
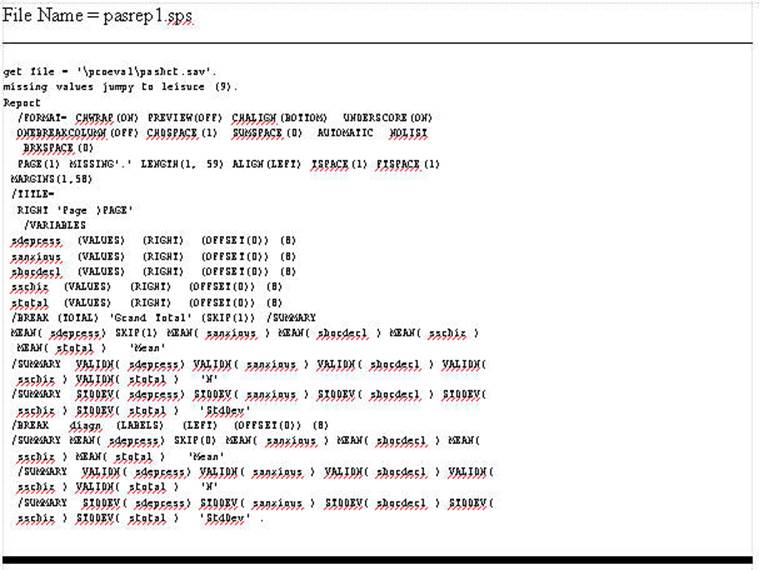
Obtaining Means and Standard Deviations Needed
for Norms
The following analysis
assumes that the above syntax file has be run and that
there is a diagnosis field where the person with the diagnosis field (DIAGN)
contains: (1) anxious = 1, (2) depression = 2, (3) borderline = 3 and (4)
schizophrenia = 4. Further, it is assumed that the diagnosis field (DIAGN) has
been sorted in ascending order.

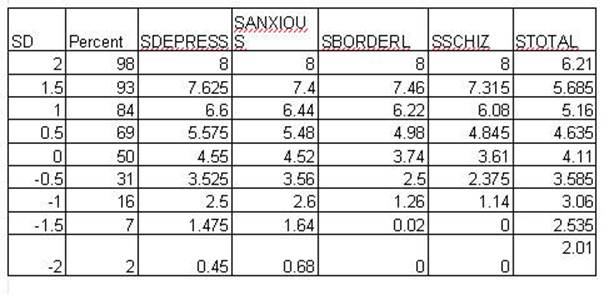
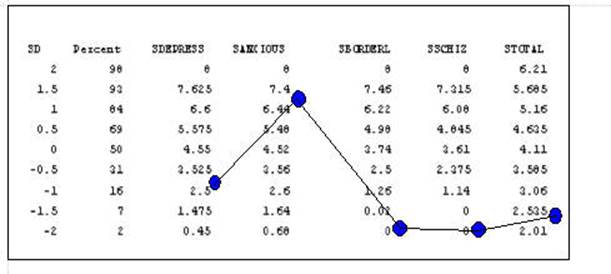
The above chart is
created in the following manner. The percentiles are taken from a normal curve
function (found in most statistical text books) at the various statard deviations from the mean. For example, at the mean
is the 50th percentile. The distance of 1 standard deviation from the mean
contains 34.134 percent of the sample. Consequently, one standard deviation
above the mean would contain 84 percent of the sampele
(50 + 34). Further, one standard deviation below the mean would contain 16
percent of the sample (50 - 34).
The numbers are filled
in the cells in the following manner. The means are filled in at 0 standard
deviations from the mean. A 1 standard deviation above the mean the standard
deviation of the sample score for that variable is added to the mean. For
example, for the variable SDEPRESS the standard deviation of 2.05 is added to
the mean (4.55) resulting in 6.6. When the standard deviation is subtracted
from 4.55 (the mean) the result is 2.5. For the same variable 1/2 standard
deviation is 1.025 and when that is added to the mean the result is 5.575. The remainder of the table is completed in the
same manner.
The subtests can be plotted in most wordprocessing programs using the Draw command as presented
in the next figure.
[NOTE: The table can
be created in a wordprocessing program such as
Word using Tables.]
(Standard Scores)